Note
Go to the end to download the full example code
Logistic Sparse Group Lasso for grouped sparse signals
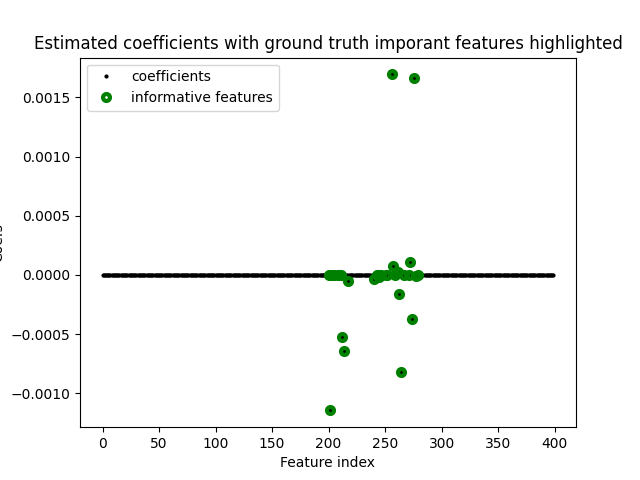
Estimates a Sparse Group Lasso logistic regression model on a simulated sparse signal. The estimated important features are compared with the ground-truth.

Indices of ground-truth informative features:
[200 201 203 205 208 209 211 212 214 217 240 243 244 245 246 251 252 256
 257 259 261 262 264 267 271 272 274 276 277 279]
Indices of non-zero estimated coefs:
[201 212 214 217 240 245 256 257 261 262 264 272 274 276 277]
import numpy as np
from matplotlib import pyplot as plt
from groupyr import LogisticSGLCV
from groupyr.datasets import make_group_classification

X, y, groups, idx = make_group_classification(
    n_samples=100,
    n_groups=20,
    n_informative_groups=3,
    n_features_per_group=20,
    n_informative_per_group=10,
    n_redundant_per_group=0,
    n_repeated_per_group=0,
    n_classes=2,
    scale=100,
    useful_indices=True,
    random_state=1729,
)

_, n_features = X.shape

model = LogisticSGLCV(
    groups=groups, l1_ratio=[0.80, 0.90], n_alphas=40, tol=1e-3, eps=1e-2, cv=3
).fit(X, y)

plt.plot(
    np.arange(n_features),
    model.coef_,
    marker="o",
    mfc="black",
    mec="none",
    ms=3,
    mew=0,
    ls="",
    label="coefficients",
)

plt.plot(
    np.arange(n_features)[idx],
    model.coef_[idx],
    marker="o",
    mfc="none",
    mec="green",
    ms=5,
    mew=3,
    ls="",
    label="informative features",
)

plt.title("Estimated coefficients with ground truth imporant features highlighted")

plt.legend(loc="best")
plt.xlabel("Feature index")
plt.ylabel("Coefs")

plt.show()

print("Indices of ground-truth informative features:")
print(np.where(idx)[0])

print("Indices of non-zero estimated coefs:")
print(model.chosen_features_)
Total running time of the script: ( 0 minutes 39.014 seconds)