Note
Go to the end to download the full example code
Sparse Group Lasso for grouped sparse signals
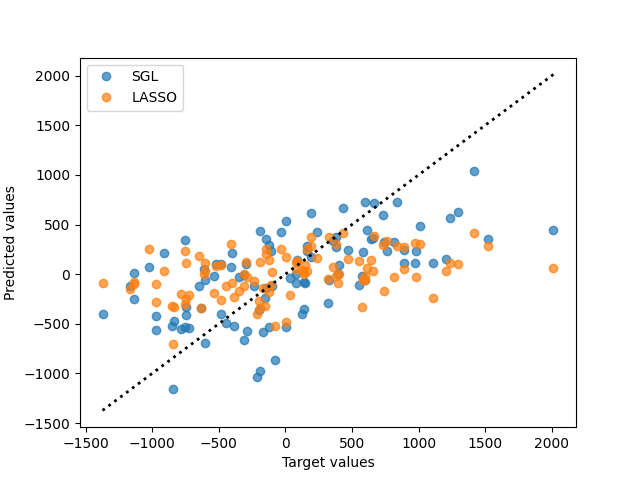
Estimates a Sparse Group Lasso model on a simulated sparse signal with high group-level sparsity. The prediction is compared to the ground truth and to the results of a Lasso model.

Lasso performance:
train: R^2 = 0.491, RMSE = 503.387
test:  R^2 = 0.160, RMSE = 623.359

SGL performance:
train: R^2 = 0.575, RMSE = 460.063
test:  R^2 = 0.352, RMSE = 547.717

<matplotlib.legend.Legend object at 0x7fee34689100>
import groupyr as gpr
import matplotlib.pyplot as plt
import numpy as np

from sklearn.model_selection import KFold
from sklearn.linear_model import LassoCV
from sklearn.metrics import r2_score, mean_squared_error
from sklearn.model_selection import train_test_split


X, y, groups, coef = gpr.datasets.make_group_regression(
    n_samples=400,
    n_groups=50,
    n_informative_groups=5,
    n_features_per_group=20,
    n_informative_per_group=18,
    noise=500,
    coef=True,
    random_state=10,
)

X_train, X_test, y_train, y_test = train_test_split(
    X, y, test_size=0.25, random_state=10
)

# Fit an SGL model for this data
cv = KFold(random_state=1729, shuffle=True)
sgl = gpr.SGLCV(
    groups=groups, cv=cv, l1_ratio=[0.0, 1.0], tuning_strategy="bayes", n_bayes_iter=50
).fit(X_train, y_train)

# Fit a Lasso model on this data
cv = KFold(random_state=1729, shuffle=True)
lasso = LassoCV(cv=cv).fit(X_train, y_train)

# Print model performance
print("Lasso performance:")
print(
    "train: R^2 = {0:5.3f}, RMSE = {1:7.3f}".format(
        r2_score(y_train, lasso.predict(X_train)),
        np.sqrt(mean_squared_error(y_train, lasso.predict(X_train))),
    )
)
print(
    "test:  R^2 = {0:5.3f}, RMSE = {1:7.3f}".format(
        r2_score(y_test, lasso.predict(X_test)),
        np.sqrt(mean_squared_error(y_test, lasso.predict(X_test))),
    )
)
print("\nSGL performance:")
print(
    "train: R^2 = {0:5.3f}, RMSE = {1:7.3f}".format(
        r2_score(y_train, sgl.predict(X_train)),
        np.sqrt(mean_squared_error(y_train, sgl.predict(X_train))),
    )
)
print(
    "test:  R^2 = {0:5.3f}, RMSE = {1:7.3f}".format(
        r2_score(y_test, sgl.predict(X_test)),
        np.sqrt(mean_squared_error(y_test, sgl.predict(X_test))),
    )
)

# Plot predicted values
plt.plot(y_test, sgl.predict(X_test), marker="o", ls="", alpha=0.7, label="SGL")
plt.plot(y_test, lasso.predict(X_test), marker="o", ls="", alpha=0.7, label="LASSO")

max_val = np.max(
    [np.max(y_test), np.max(lasso.predict(X_test)), np.max(sgl.predict(X_test))]
)
min_val = np.min(
    [np.min(y_test), np.min(lasso.predict(X_test)), np.min(sgl.predict(X_test))]
)

plt.plot([min_val, max_val], [min_val, max_val], ls=":", lw=2, color="black")
plt.xlabel("Target values")
plt.ylabel("Predicted values")

plt.legend()
Total running time of the script: ( 1 minutes 11.729 seconds)