Note
Go to the end to download the full example code.
Integrating FracRidge objects into sklearn pipelines
Because Fracridge is implemented using a Scikit-Learn-compatible API,
the objects in the library can be integrated into pipelines that use
objects from the Scikit Learn library.
For example, here we will demonstrate a dimensionality reduction followed by a grid search to find the best fraction for the fraction parameter.
Imports
import numpy as np
import matplotlib.pyplot as plt

from sklearn.decomposition import PCA
from sklearn.pipeline import Pipeline
from sklearn.datasets import make_regression

from fracridge import FracRidgeRegressorCV
We generate synthetic data
np.random.seed(1984)
n_targets = 15
n_features = 80
effective_rank = 20
X, y, coef_true = make_regression(
                    n_samples=250,
                    n_features=n_features,
                    effective_rank=effective_rank,
                    n_targets=n_targets,
                    coef=True,
                    noise=10)
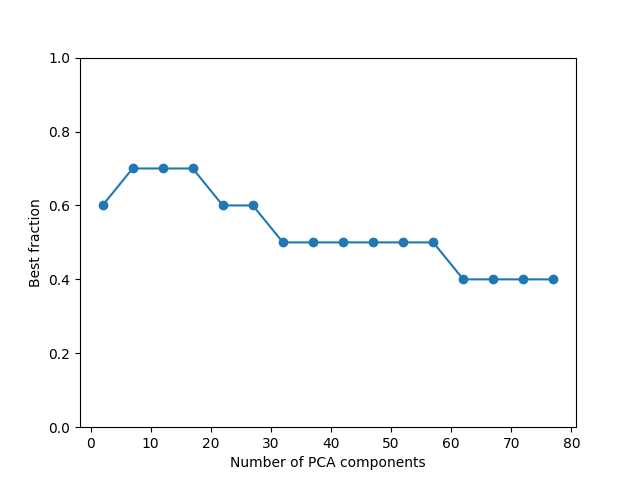
Iterating over the number of features, we generate design matrices that have more and more dimensions in them. As the number of data dimensions grows, the best fraction for FracRidge decreases.
best_fracs = []

for n_components in range(2, X.shape[-1], 5):
    pca = PCA(n_components=n_components)
    frcv = FracRidgeRegressorCV()
    pipeline = Pipeline(steps=[('pca', pca), ('fracridgecv', frcv)])
    pipeline.fit(X, y)
    best_fracs.append(pipeline['fracridgecv'].best_frac_)

fig, ax = plt.subplots()
ax.plot(range(2, X.shape[-1], 5), best_fracs, 'o-')
ax.set_ylim([0, 1])
ax.set_ylabel("Best fraction")
ax.set_xlabel("Number of PCA components")

plt.show()

Total running time of the script: (0 minutes 11.320 seconds)